Space solar power and the British grid
One windless week and the bar for space solar
On the same price year and discount rate, a study for the UK government prices space solar power below the cost of reliable wind and sun for Britain in 2050, and a NASA study at nearly nine times that cost, though both count only the station, not backup.
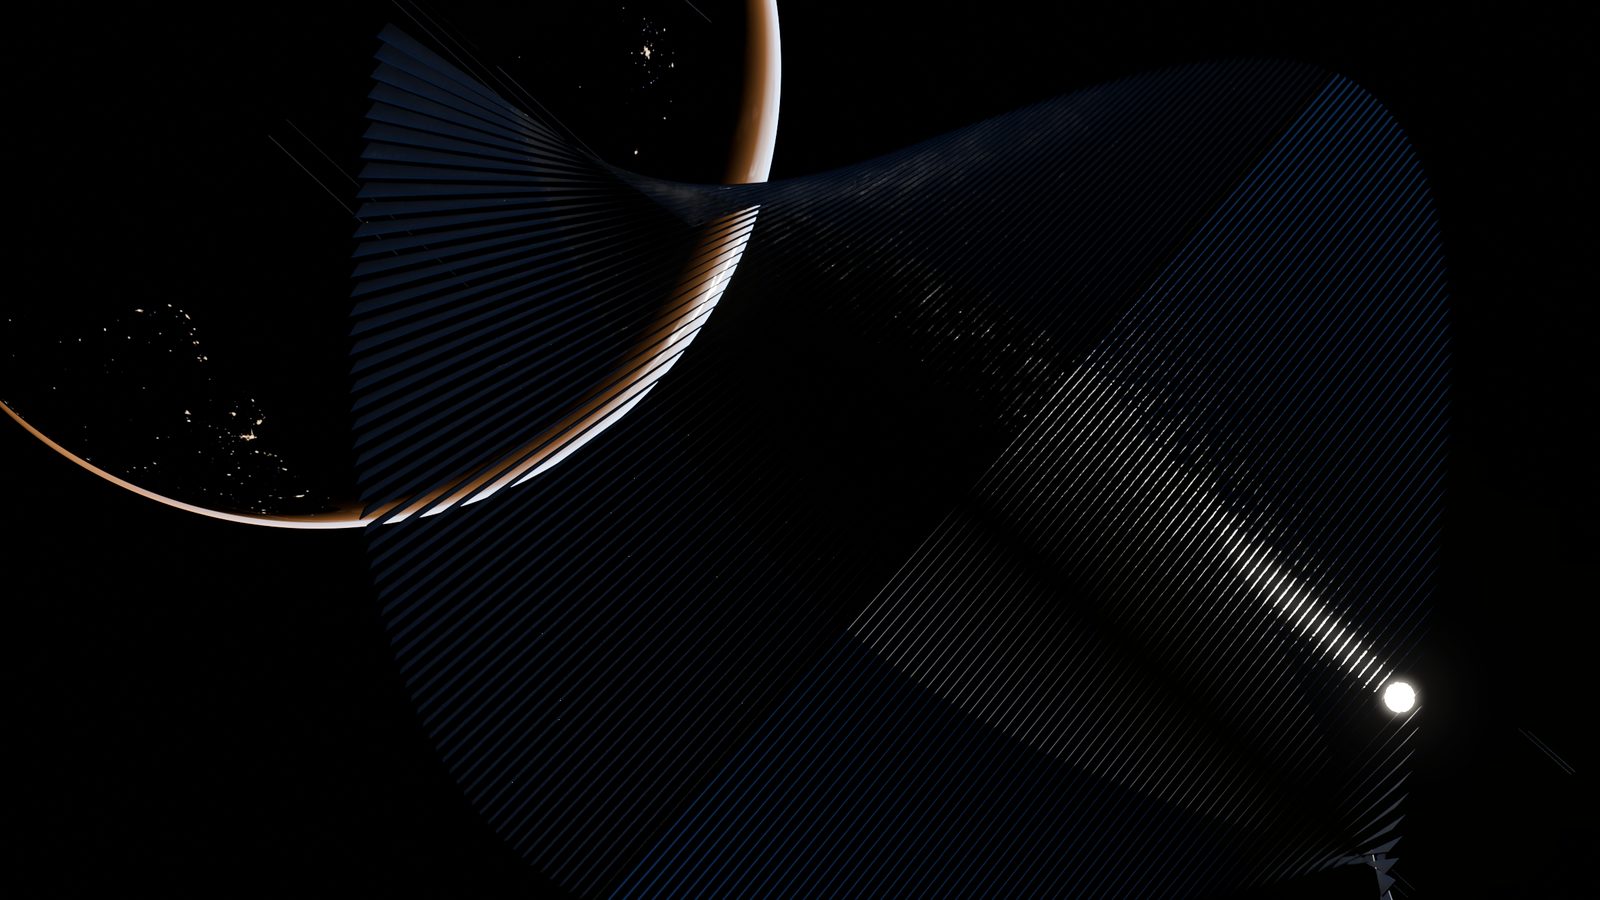
Design concept, not built.
In geostationary orbit, the satellite would be in sunlight about 99 per cent of the year. [1]
Imagery: NASA Earth Observatory (Blue Marble Next Generation); NASA Goddard Space Flight Center (Black Marble 2016). Own work with NASA imagery: NASA Images and Media guidelines.
From 3 to 9 November 2024, the wind over Britain stayed weak. [2] Wind made nearly 30 per cent of the grid's electricity that year, but only about a tenth that week, and gas power stations made about half. [2]
Interactive 1 When the wind dropped for a week in November 2024, gas made about half of Britain's electricity. [2]
Point at or tap the chart to read the supply at that time. Zoom out to see the week against the whole year.
Gigawatts, every half-hour, stacked by source, with wind and solar at the bottom; solar is the amber band on top of wind and is too thin to see in most of the week. The flat red line is 2 gigawatts, about the output of one NASA-size space solar plant. [2], [3] [4, pp. 8, 9] The solar band leaves out solar farms on the transmission grid and batteries, which NESO files under other. [2]
Drawn for Energy Aperture from NESO's half-hourly generation mix. Supported by National Energy SO Open Data.
Drawing on the Met Office, the Royal Society lists a winter spell of very low wind, lasting up to a week, as happening every few years. [5, PDF pp. 6, 17, 18] In its model of a 2050 grid, a run of low-wind years, 2009 to 2011, drained the energy store hardest. [5, PDF pp. 6, 17, 18] A grid that runs on wind and sun needs backup for spells like these, from power stations and energy stores that run whatever the weather. [5, pp. 7, 8, 62], [6, PDF pp. 17-18] The cost per unit usually quoted for wind and solar power omits that backup. [6, pp. 6, 16, 42-43], [7, pp. 33, 75]
Wind and sun with that backup counted is the bar for space solar power. A Royal Society model puts wind and sun made reliable for Britain in 2050 at about 6 to 11 pence a kilowatt-hour, the unit on a household bill. [5, pp. 7, 8, 62], [8], [9] Put on common terms, a study for the UK government prices a first space power station below that, and NASA's study at nearly nine times the top of it. [8], [9] Both figures cover the station alone, not backup, so they show where each study sits, not what its power would cost in full. [8], [9] The largest known reason the two sit so far apart is the launch price each assumes. [10]
One space design would run almost all year
A solar power station in geostationary orbit, the orbit about 36,000 kilometres up in which a satellite stays over one point on the equator, would be in sunlight about 99 per cent of the year. [1], [11, PDF p. 184] For about six weeks around each equinox, it passes through the Earth's shadow once a night, for up to about 70 minutes. [1] It would beam its power down as microwaves to a rectenna, a field of antennas on the ground that turns the beam back into electricity. [12, p. 10] A 2021 study for the UK government draws one design, CASSIOPeiA, at about 1.7 kilometres across and 2,000 tonnes, sending 2 gigawatts, or 2 billion watts, into the grid. [13, PDF p. 15] That is about twice the height of the tallest building in the world, and it is a design, not a built satellite. [13, PDF p. 15]
NASA's 2024 study has two designs, one with large mirrors and one a flat panel. [4, pp. 8, 9] It models the mirror design as generating for 99.7 per cent of the year, and the flat panel for only 60 per cent. [4, PDF p. 68] The UK government's 2021 cost model counts no downtime at all, which its authors call slightly optimistic. [8, pp. 3, 4, 6, 8] Power stations on the ground do not run flat out either. Britain's capacity market counts a gas plant at 88 to 92 per cent of its capacity and a nuclear plant at 75 to 85 per cent. [14], [15, PDF pp. 20-21] From 2012 to 2022, planned and unplanned shutdowns cost Britain's older nuclear reactors a fifth to a third of the output they could have made. [16, PDF pp. 50-51] The 99 per cent in sunlight allows only for the Earth's shadow, not for failures or repairs. [1], [8, pp. 3, 4, 6, 8]
A design that runs for 99.7 per cent of the year would supply power almost all the time, [4, PDF p. 68] so its cost should be set against wind and sun made just as reliable, with their backup counted. For sudden faults, Britain sizes its fast reserve by the largest single block of power it could lose at once, not by fuel. [17, PDF p. 28], [18, PDF p. 42], [19, PDF p. 19], [20, PDF p. 600], [21, PDF p. 153] So a space station would need roughly the fast reserve of a gas station the same size, with other stations covering its eclipse nights. [17, PDF p. 28], [18, PDF p. 42], [19, PDF p. 19], [20, PDF p. 600], [21, PDF p. 153]
The cost usually quoted omits the backup
The usual measure is the levelised cost of electricity, or LCOE, which spreads a power station's lifetime costs over all the units of electricity it produces. [6, p. 25], [7, pp. 33-35], [22, p. 1] It prices a station alone, and excludes the backup the grid needs when that station's output falls. [6, pp. 6, 16, 42-43], [7, pp. 33, 75] The International Energy Agency and the Nuclear Energy Agency call it an incomplete measure of competitiveness, [7, pp. 33, 75] and the US Energy Information Administration calls comparing technologies on it alone "problematic and misleading". [22, p. 3]
Picture a commuter who takes the bus home but needs a taxi on nights when the last bus has gone. The bus is wind and solar power, the fare is its LCOE, and the taxi is backup. Over a year, getting home costs the bus fares plus the occasional taxi, so quoting the fare alone makes the journey look cheaper than it is. The analogy breaks in two places. Backup must be built and paid for all year, not only on the nights it runs, and wind keeps no timetable, so backup must be ready at any hour. [2], [6, PDF pp. 17-18]
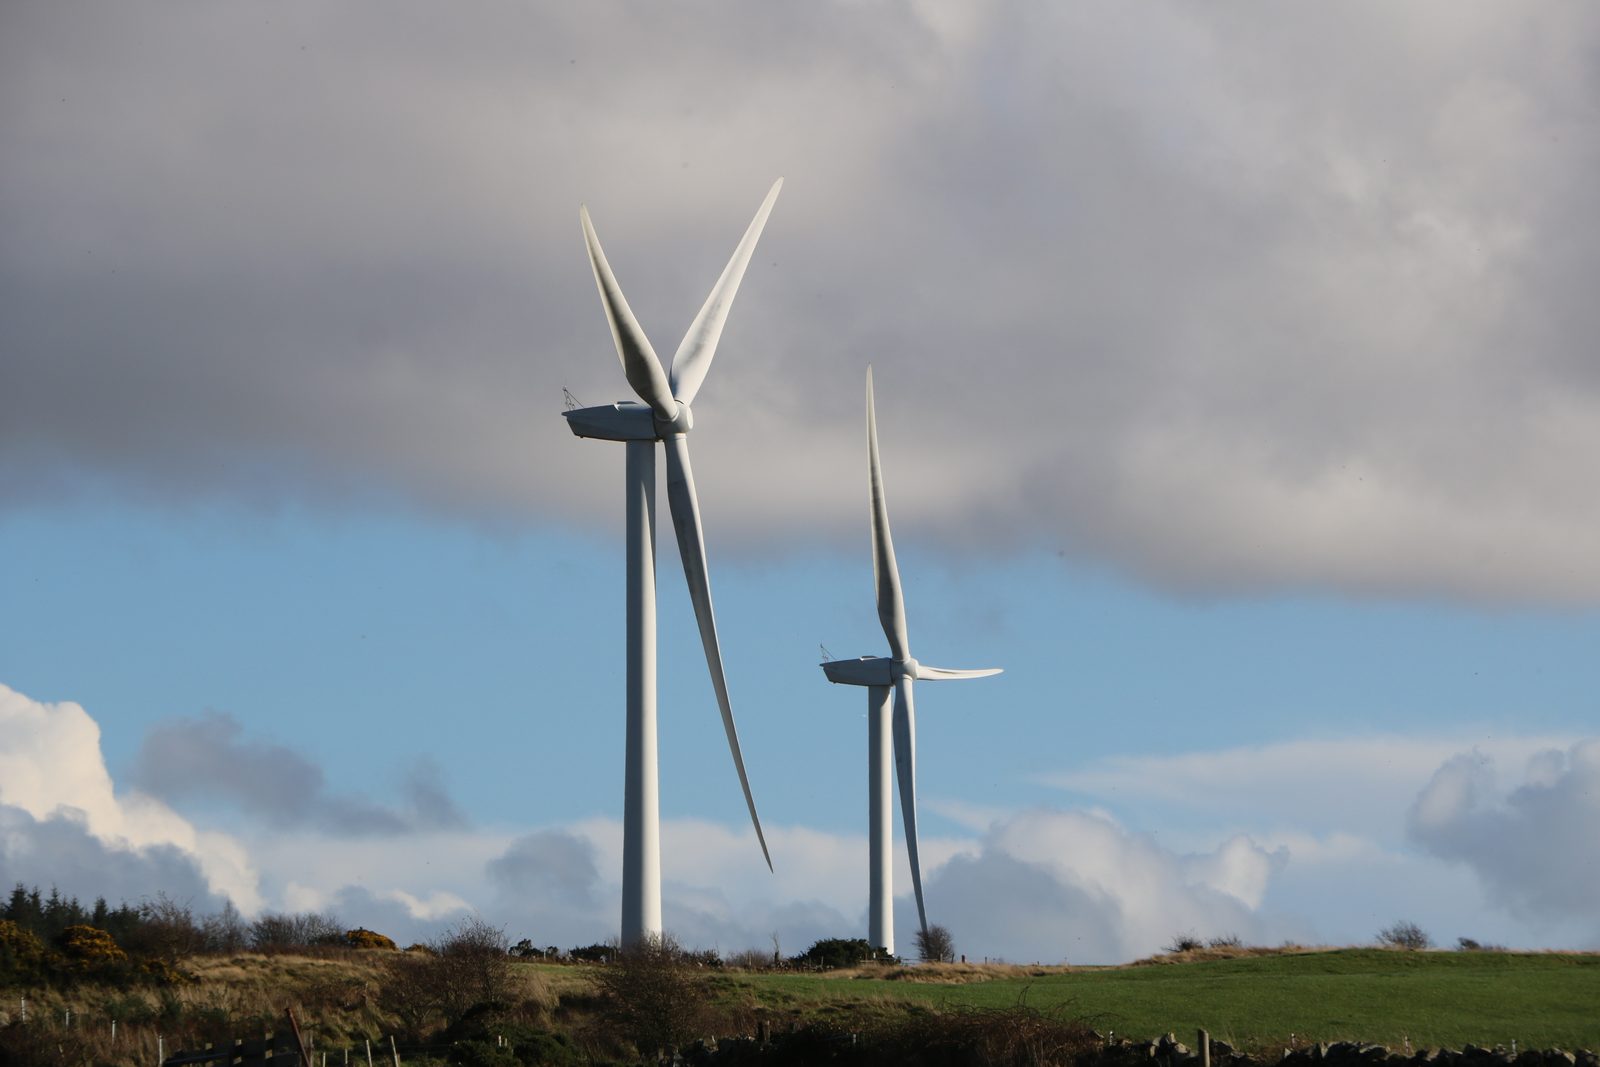
Photo 1 Illustrative: wind turbines in Dumfries and Galloway in 2022, not the week described.
"Wind Turbines at Rest" by Billy McCrorie, Geograph. CC BY-SA 2.0.
Wider measures count more of what a reliable grid needs. [7, pp. 33, 75] Table 1 lists five, from the narrowest to the widest, and Figure 1 shows how each adds to the one before. The last column shows which have been calculated for space solar.
| Measure | What it covers | A study that uses it | Calculated for space solar? |
|---|---|---|---|
| LCOE | A station's whole lifetime cost per unit it makes [6, p. 25], [7, pp. 33-35], [22, p. 1] | The UK and NASA space studies [4, pp. 8, 9], [9, pp. 19, 23, 29-31] | Yes, station only [8], [9] |
| Capacity value | Also includes how much of its output the grid can rely on [23, p. 3] | A US study of solar farms [23, p. 3] | No [6], [22], [23], [24], [25] |
| Firming cost | Also includes backup for the part the grid cannot rely on [6, PDF pp. 17-18] | Lazard, for US wind and solar [6, PDF pp. 17-18] | No [6], [22], [23], [24], [25] |
| VALCOE, the International Energy Agency's value-adjusted LCOE | Also includes when its power comes and how easily its output can be raised or lowered [7, p. 75], [26, pp. 58-60] | Roland Berger, for the European Space Agency in 2022 [27] | Yes, 2022 [27] |
| Whole-system cost | Also includes the rest of the power system [7, pp. 33, 75] | The Royal Society benchmark comes close [5, pp. 7, 8, 62] | Europe only [28] |
Figure 1 LCOE counts only the power station, and each wider measure counts more of what reliable power needs. [6, p. 25], [7, pp. 33-35], [22, p. 1]
Drawn for Energy Aperture from the records cited.
Reliable wind and sun would cost Britain about 6 to 11 pence a kilowatt-hour in 2050
So what would reliable power cost? For Britain in 2050, a Royal Society model puts it at about 6 to 11 pence a kilowatt-hour in 2024 prices. [5, pp. 7, 8, 62], [8], [9] The model runs a British grid on wind and sun alone against the weather of 37 past years. [5, pp. 7, 8, 62] Spare power makes hydrogen from water by electrolysis, and the stored hydrogen is turned back into electricity when wind and sun run low, while batteries keep the grid stable. [5, pp. 7, 8, 62]
Explainer Why the discount rate matters
The low end assumes cheap storage and a 5 per cent discount rate, the high end expensive storage and 10 per cent. [5, pp. 7, 8, 62] It is a modelled cost of power into the grid, not a forecast and not a household price. [5, pp. 7, 8, 62] In the model, reliable power costs about 1.7 to 2 times what the wind and solar power alone costs. [5, PDF p. 7], [29] The hydrogen store supplies only about 15 per cent of the electricity, but each unit from it costs many times as much as power straight from the farms. [5, pp. 7, 63]
Figure 2 Per unit, the wind and solar farms alone cost less than the reliable system built from them. [5, pp. 7, 8, 62]
Drawn for Energy Aperture from the records cited.
Space solar estimates fall either side of Britain's benchmark
The UK study, by the consultancy Frazer-Nash for the government in 2021, puts a first space power station at 6.6 pence a kilowatt-hour. [9, pp. 19, 23, 29-31] That is in 2018 prices and at a 20 per cent discount rate, far above the Royal Society's 5 to 10 per cent. [5, pp. 7, 8, 62], [9, pp. 19, 23, 29-31] For 2050, NASA's study puts its mirror design at 61 US cents a kilowatt-hour and the flat panel at 159 cents, at a 3 per cent rate. [4, pp. 8, 9] NASA found that neither competes with power stations on the ground unless several improvements come together. [4, PDF p. 9]
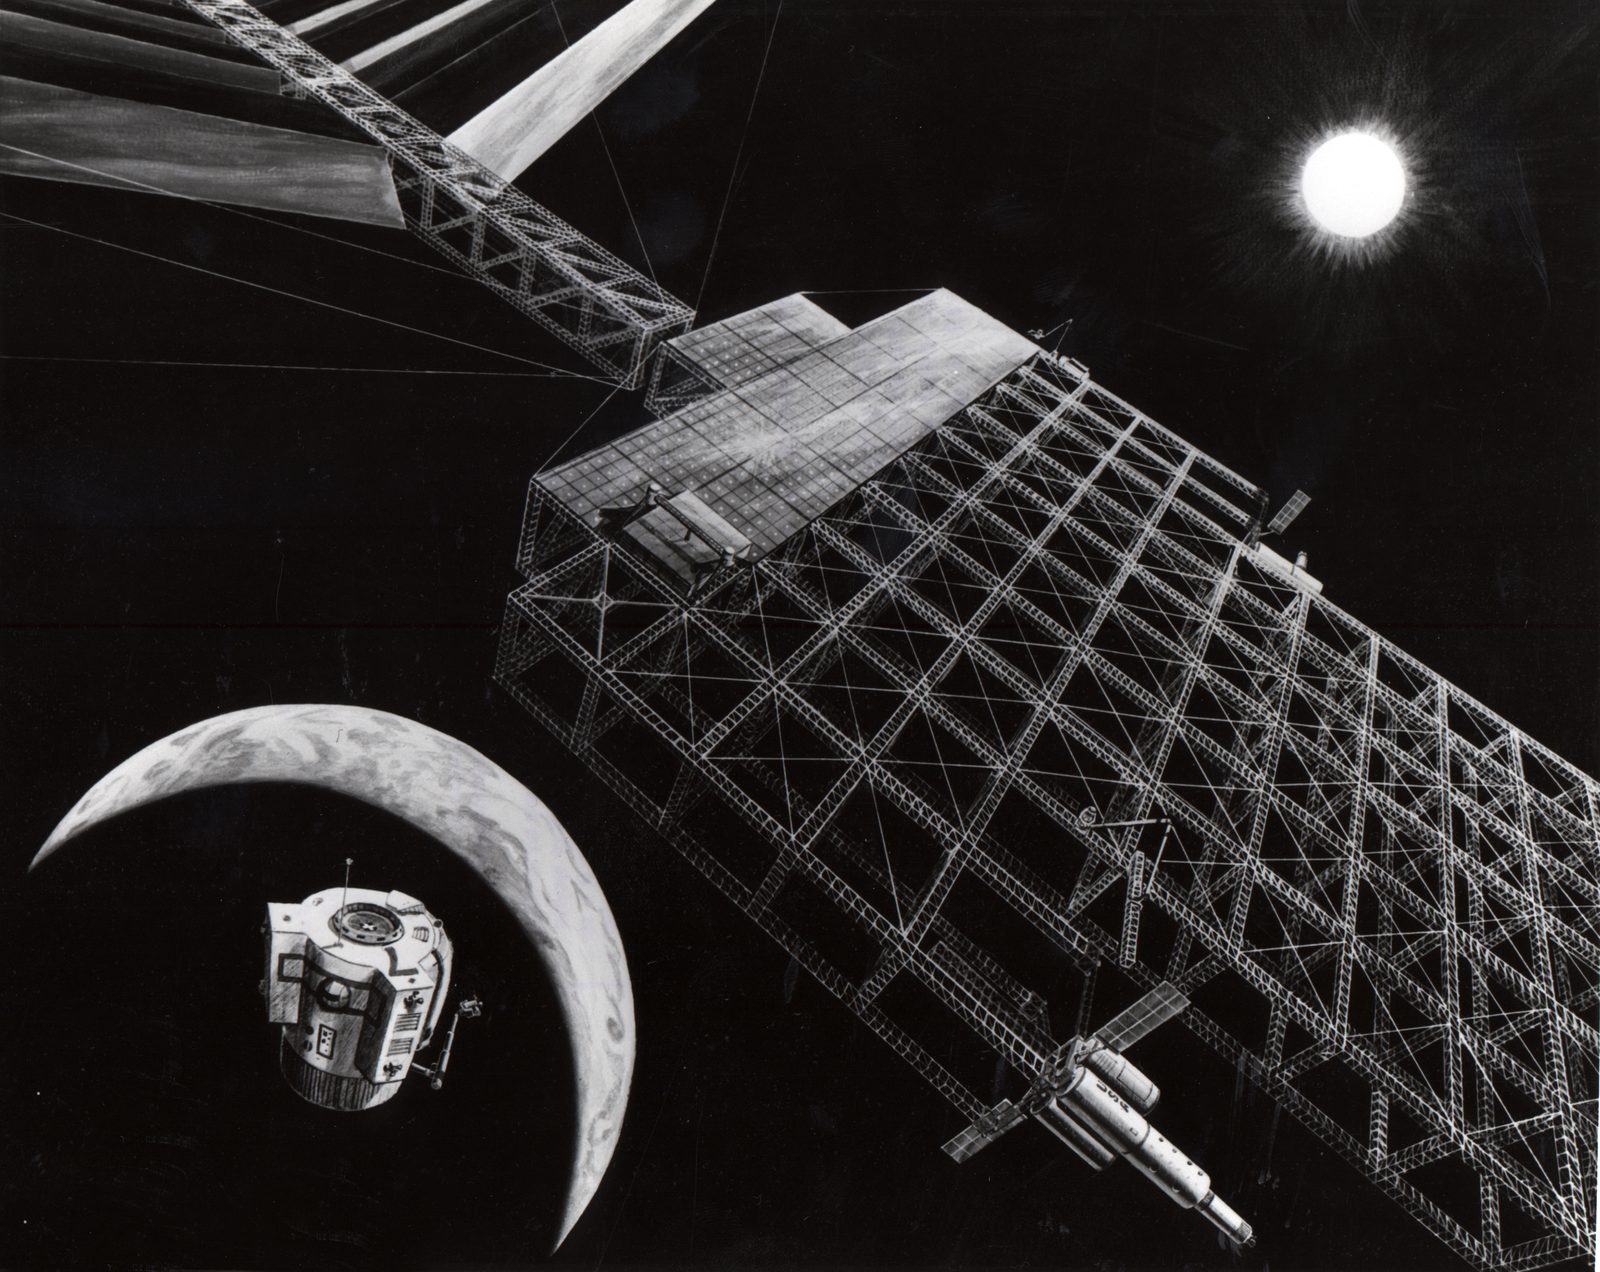
Photo 2 Design concept, not built: a NASA painting of a solar power satellite from 1976.
To compare the three, this site's own calculation puts them all in 2024 pounds, with both space studies at a 10 per cent discount rate and a 20-year life, rebuilding NASA's cost model on those terms. [30], [31], [32] The benchmark is the top of the Royal Society range, about 11 pence, which uses the same 10 per cent rate and is the most generous test for space solar power. [8], [9] The comparison is still not like for like. The benchmark is a whole reliable system, and the space figures are a station alone, with nothing for backup in eclipse or maintenance, so they are a lower limit on its full cost. [8, pp. 3, 4, 6, 8], [9]
On these terms, the UK study's 6.6 pence becomes about 4.9 pence, under half the benchmark. [8], [9] NASA's 61 cents at 3 per cent becomes about 93 pence at 10 per cent, nearly nine times the benchmark, mostly because of the higher rate. [8], [9], [32] Its flat panel design comes to about 17 times. [8], [9]
Launch is most of NASA's cost, but cheaper rockets alone are not enough
Launch is 71 per cent of the mirror design's cost in NASA's main case. [4, pp. 8, 9] Building one station and replacing its hardware twice over 30 years would take about 2,300 launches in NASA's model. [4, PDF p. 8], [33] Twelve of every 13 would be tankers, carrying only fuel to refill each cargo rocket in low Earth orbit, close to the Earth, for its climb to geostationary orbit. [4, PDF p. 8]
Figure 3 NASA refuels its cargo rockets in low Earth orbit, while the UK study's station makes the final climb under its own power. [4, PDF pp. 27, 38, 65], [8, PDF p. 11], [9, PDF p. 62], [12, PDF p. 15], [34, p. 11], [35, p. 135], [36, p. 4]
Drawn for Energy Aperture from the records cited.
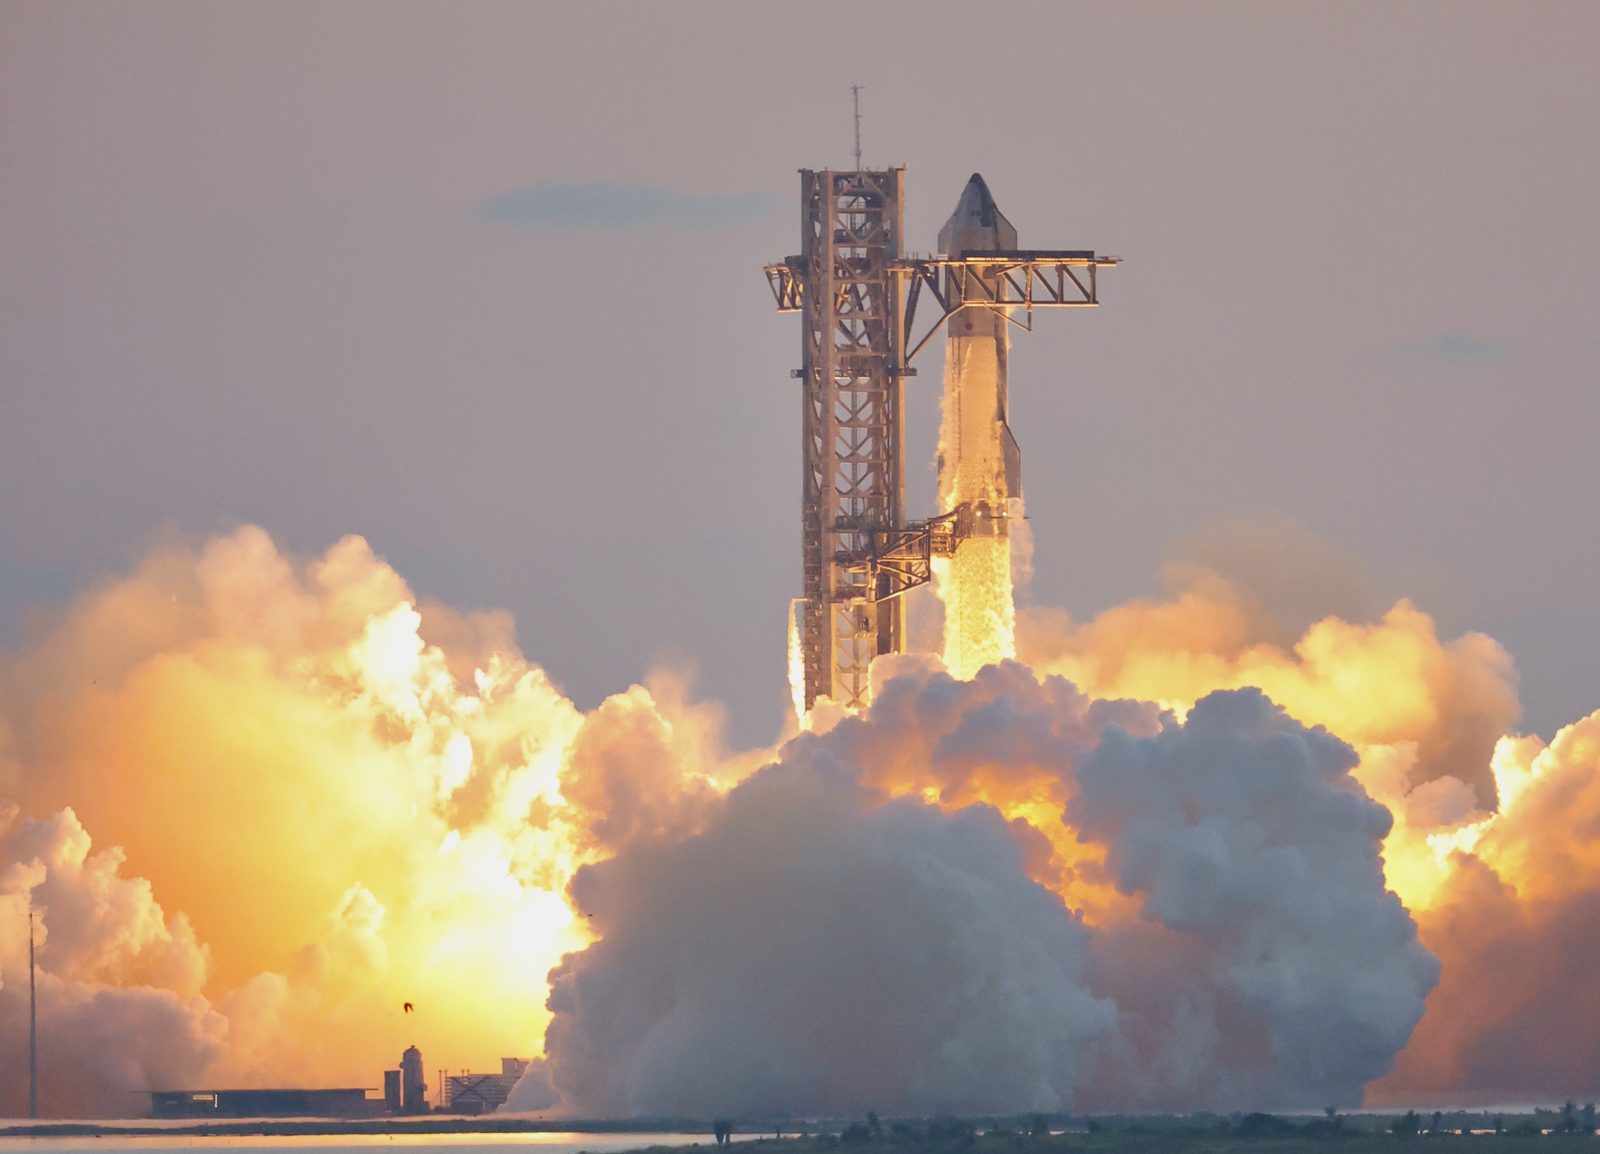
Photo 3 NASA's plan would need about 2,300 rocket launches for one station. [4, PDF p. 8]
Shown: SpaceX's Starship on a test flight in October 2024.
"SpaceX Ignition" by Steve Jurvetson, Flickr, cropped. CC BY 2.0.
NASA assumed a launch price per kilogram several times the UK study's, [10] and as of September 2026 no launch contract of this size had been signed at either price. [8], [37], [38] Would cheaper rockets fix that? Not on their own. In NASA's own figures, cheaper launch alone brings the mirror design down from 61 to about 20 cents a kilowatt-hour, which NASA says is still not competitive. [4, PDF p. 9] On the common terms, cutting NASA's launch price to a tenth lowers the mirror design from about 93 pence to about 34, still about three times the benchmark. [4], [8], [9]
Figure 4 Across the launch prices NASA tested, its mirror design stays above Britain's benchmark, even with cheaper launch. [4], [8], [9], [30], [31], [32], [39]
Drag the launch price; NASA's estimate moves along its line.
Pence per unit (kilowatt-hour) in 2024 prices, at a real discount rate of 10 per cent over 20 years, against the launch price per kilogram delivered to geostationary orbit; both scales are logarithmic. [4, PDF pp. 27, 38, 65], [8], [9], [32], [39] NASA's line runs only over the launch prices NASA tested, USD 10 million to 100 million a launch, and NASA found that no single change brings its design down to the cost of its ground power stations. [4, PDF p. 9] The UK study's points are its two published launch cases; its central case draws on a range of launch prices, so it has no single place on this axis. [9, p. 23] The two studies reach orbit by different routes. [4, PDF pp. 27, 65], [8, PDF p. 11] The band is Britain's benchmark: the Royal Society's reliable wind and sun for Britain in 2050. [30]
Drawn for Energy Aperture from NASA's model, rebuilt, with other inputs fixed, and the UK study's published cases.
Only when several improvements come together, cheaper launch among them, does NASA find the mirror design competitive with power stations on the ground. [4, PDF p. 9] On the common terms, that best case comes to about 5.8 pence a kilowatt-hour, roughly half the benchmark. [4], [8], [9] NASA did not say how likely that combination is. [4, PDF p. 9]
A model of Europe built space solar only at NASA's best-case cost
A peer-reviewed 2025 study from Xi'an Jiaotong University and King's College London modelled Europe's power system, letting the model pick the cheapest mix of power stations that meets demand. [28] Given costs that match NASA's best case, the model built the mirror design. [28] It found that this cut the system's total cost by 7 to 15 per cent and replaced up to 80 per cent of the wind and solar power. [28] At NASA's main cost estimate, the model built no space solar power at all, because the alternatives always came out cheaper. [28] It costed space solar at NASA's 3 per cent rate and does not say what rate wind, solar and the rest were given, so it does not show whether its rivals faced the same terms. [28, PDF p. 13]
For Britain alone, the closest study is a 2025 one for the UK government by Frazer-Nash with Imperial College London and the company Space Solar. [28, PDF pp. 12, 13, 16], [40, PDF pp. 2, 4, 13, 39-40, 42, 92-93], [41] It found a small station in 2040 worth about 23 million pounds a year from the power stations it would displace, scaled down by about 20 from a much larger station in its model. [28, PDF pp. 12, 13, 16], [40, PDF pp. 40, 42, 26, 4], [41] The researchers placed the station in the model themselves, so the model never judged whether it earned its place, or how many would be worth building. [28, PDF pp. 12, 13, 16], [40, PDF pp. 2, 4, 13, 39-40, 42, 92-93], [41] A search on 13 October 2026 found no published whole-system model of Britain's grid in which space solar power competes for a place. [28, PDF pp. 12, 13, 16], [40, PDF pp. 2, 4, 13, 39-40, 42, 92-93], [41]
The fair test is the whole-system cost of meeting Britain's needs
Britain's grid has requirements that come before cost: net zero carbon, power whenever it is needed, and a supply the country can secure. On carbon, NASA puts both designs within the range it gives for renewable power on the ground. [4, p. 9] It says they may be similar, pending further studies, and its figures leave out rocket exhaust high in the atmosphere, which is still being studied. [4, p. 9], [22] The UK study of 2021 also expects a large economic benefit, about 1.80 pounds of activity for each pound of public money spent developing a first station, an estimate that does not subtract activity that would have happened anyway. [9, p. 44], [13, PDF p. 2], [42, pp. 20-22]
With those requirements fixed, the fair comparison is the whole-system cost of meeting them: what Britain would pay for all the power stations, stores and lines it needs, with space solar power in the mix and without it. [7, pp. 33, 75] Such a model would settle the question, because the model, not its authors, decides whether to build space solar power and how much. Space Solar, a UK start-up, said in October 2024 that it had agreed to supply an Icelandic utility with 30 megawatts from a first space plant by 2030, in a company statement that gives no price or financing. [43]